<< Tilbage til sammenligning af EU-stemmer
Sammenligning af stemmeafgivelser i Europa-parlamentet
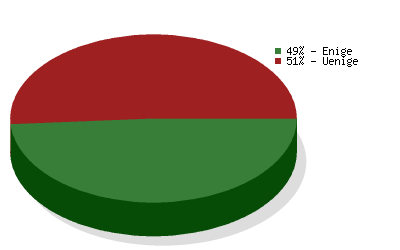
 Socialdemokraterne
vs.
JuniBevægelsen
Socialdemokraterne
vs.
JuniBevægelsen 
Sammenligning af stemmeafgivelser i Europa-parlamentet
Sammenligningen er baseret på
5011 afstemninger
og dækker valgperiode 2004-2009
og dækker valgperiode 2004-2009
| Politikområde | Grad af enighed | Antal afstemninger |
|---|---|---|
| Environment, Public Health and Food Safety | 65 % | 571 |
| Foreign Affairs | 42 % | 349 |
| Budgets | 32 % | 311 |
| Civil Liberties, Justice and Home Affairs | 54 % | 291 |
| Economic and Monetary Affairs | 37 % | 284 |
| Transport and Tourism | 49 % | 250 |
| Industry, Research and Energy | 44 % | 224 |
| Budgetary Control | 62 % | 221 |
| Internal Market and Consumer Protection | 57 % | 215 |
| Constitutional Affairs | 26 % | 207 |
| Agriculture | 45 % | 206 |
| Employment and Social Affairs | 43 % | 190 |
| EP Delegation to Conciliation | 60 % | 151 |
| Culture and Education | 33 % | 133 |
| Legal Affairs | 64 % | 130 |
| International Trade | 46 % | 126 |
| Regional Development | 30 % | 121 |
| Fisheries | 43 % | 94 |
| Women's Rights and Gender Equality | 75 % | 87 |
| Development | 74 % | 78 |
| Use of European countries by the CIA | 43 % | 35 |
| The enlarged Union for 2007-2013 | 40 % | 30 |
| Petitions | 61 % | 23 |