<< Tilbage til sammenligning af EU-stemmer
Sammenligning af stemmeafgivelser i Europa-parlamentet
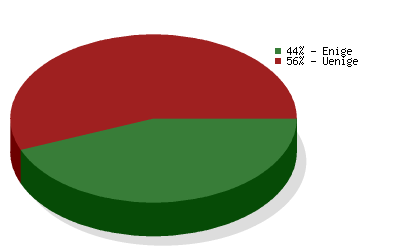
 Dansk Folkeparti
vs.
JuniBevægelsen
Dansk Folkeparti
vs.
JuniBevægelsen 
Sammenligning af stemmeafgivelser i Europa-parlamentet
Sammenligningen er baseret på
5263 afstemninger
og dækker valgperiode 2004-2009
og dækker valgperiode 2004-2009
| Politikområde | Grad af enighed | Antal afstemninger |
|---|---|---|
| Environment, Public Health and Food Safety | 57 % | 562 |
| Foreign Affairs | 36 % | 366 |
| Budgets | 41 % | 330 |
| Economic and Monetary Affairs | 38 % | 305 |
| Civil Liberties, Justice and Home Affairs | 27 % | 301 |
| Transport and Tourism | 45 % | 259 |
| Agriculture | 44 % | 251 |
| Industry, Research and Energy | 39 % | 238 |
| Budgetary Control | 48 % | 235 |
| Internal Market and Consumer Protection | 65 % | 220 |
| Constitutional Affairs | 63 % | 220 |
| Employment and Social Affairs | 32 % | 196 |
| EP Delegation to Conciliation | 61 % | 160 |
| Legal Affairs | 53 % | 145 |
| International Trade | 35 % | 142 |
| Culture and Education | 49 % | 140 |
| Regional Development | 24 % | 127 |
| Fisheries | 49 % | 107 |
| Women's Rights and Gender Equality | 53 % | 92 |
| Development | 54 % | 78 |
| Use of European countries by the CIA | 8 % | 36 |
| The enlarged Union for 2007-2013 | 69 % | 32 |
| Petitions | 64 % | 22 |