<< Tilbage til sammenligning af EU-stemmer
Sammenligning af stemmeafgivelser i Europa-parlamentet
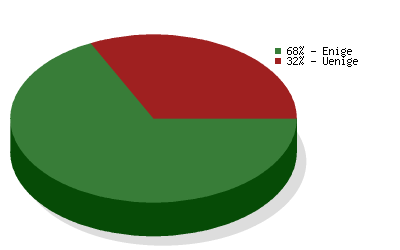
 Socialistisk Folkeparti
vs.
Folkebevægelsen mod EU
Socialistisk Folkeparti
vs.
Folkebevægelsen mod EU 
Sammenligning af stemmeafgivelser i Europa-parlamentet
Sammenligningen er baseret på
3808 afstemninger
og dækker valgperiode 2004-2009
og dækker valgperiode 2004-2009
| Politikområde | Grad af enighed | Antal afstemninger |
|---|---|---|
| Environment, Public Health and Food Safety | 82 % | 375 |
| Economic and Monetary Affairs | 60 % | 247 |
| Foreign Affairs | 60 % | 243 |
| Civil Liberties, Justice and Home Affairs | 71 % | 239 |
| Budgets | 58 % | 221 |
| Internal Market and Consumer Protection | 85 % | 204 |
| Agriculture | 61 % | 203 |
| Transport and Tourism | 70 % | 185 |
| Constitutional Affairs | 29 % | 182 |
| Industry, Research and Energy | 78 % | 163 |
| Budgetary Control | 85 % | 158 |
| Employment and Social Affairs | 63 % | 142 |
| International Trade | 64 % | 135 |
| Culture and Education | 44 % | 114 |
| Legal Affairs | 74 % | 108 |
| EP Delegation to Conciliation | 78 % | 83 |
| Fisheries | 61 % | 75 |
| Regional Development | 50 % | 66 |
| Women's Rights and Gender Equality | 92 % | 60 |
| Development | 95 % | 56 |
| Use of European countries by the CIA | 61 % | 18 |
| Climate Change | 88 % | 16 |
| Petitions | 73 % | 11 |