<< Tilbage til sammenligning af EU-stemmer
Sammenligning af stemmeafgivelser i Europa-parlamentet
 Det Radikale Venstre
vs.
Folkebevægelsen mod EU
Det Radikale Venstre
vs.
Folkebevægelsen mod EU 
Sammenligning af stemmeafgivelser i Europa-parlamentet
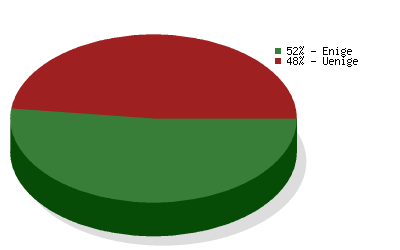
Sammenligningen er baseret på
3061 afstemninger
og dækker valgperiode 2004-2009
og dækker valgperiode 2004-2009
| Politikområde | Grad af enighed | Antal afstemninger |
|---|---|---|
| Environment, Public Health and Food Safety | 60 % | 232 |
| Economic and Monetary Affairs | 29 % | 204 |
| Civil Liberties, Justice and Home Affairs | 58 % | 197 |
| Budgetary Control | 79 % | 191 |
| Budgets | 52 % | 167 |
| Foreign Affairs | 39 % | 167 |
| Transport and Tourism | 52 % | 157 |
| Employment and Social Affairs | 48 % | 151 |
| Industry, Research and Energy | 58 % | 142 |
| Agriculture | 54 % | 132 |
| Constitutional Affairs | 25 % | 122 |
| Legal Affairs | 70 % | 118 |
| International Trade | 33 % | 106 |
| Culture and Education | 40 % | 100 |
| Internal Market and Consumer Protection | 53 % | 88 |
| EP Delegation to Conciliation | 59 % | 70 |
| Fisheries | 43 % | 67 |
| Regional Development | 44 % | 64 |
| Women's Rights and Gender Equality | 82 % | 50 |
| Development | 79 % | 39 |
| Climate Change | 81 % | 16 |
| Petitions | 70 % | 10 |