<< Tilbage til sammenligning af EU-stemmer
Sammenligning af stemmeafgivelser i Europa-parlamentet
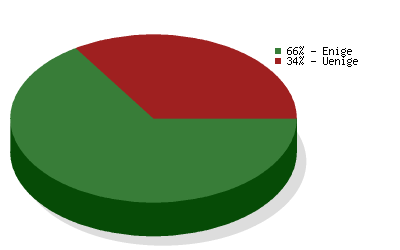
 Socialistisk Folkeparti
vs.
Det Radikale Venstre
Socialistisk Folkeparti
vs.
Det Radikale Venstre 
Sammenligning af stemmeafgivelser i Europa-parlamentet
Sammenligningen er baseret på
3821 afstemninger
og dækker valgperiode 2004-2009
og dækker valgperiode 2004-2009
| Politikområde | Grad af enighed | Antal afstemninger |
|---|---|---|
| Environment, Public Health and Food Safety | 61 % | 336 |
| Budgets | 80 % | 273 |
| Civil Liberties, Justice and Home Affairs | 76 % | 242 |
| Economic and Monetary Affairs | 43 % | 228 |
| Foreign Affairs | 65 % | 223 |
| Industry, Research and Energy | 65 % | 215 |
| Transport and Tourism | 60 % | 177 |
| Agriculture | 61 % | 170 |
| Employment and Social Affairs | 68 % | 167 |
| Budgetary Control | 92 % | 163 |
| EP Delegation to Conciliation | 74 % | 125 |
| Legal Affairs | 82 % | 119 |
| Constitutional Affairs | 74 % | 114 |
| Regional Development | 58 % | 101 |
| Internal Market and Consumer Protection | 53 % | 98 |
| International Trade | 41 % | 97 |
| Culture and Education | 82 % | 96 |
| Fisheries | 55 % | 82 |
| Women's Rights and Gender Equality | 73 % | 77 |
| Development | 79 % | 52 |
| The enlarged Union for 2007-2013 | 74 % | 34 |
| Petitions | 60 % | 20 |
| Use of European countries by the CIA | 94 % | 17 |
| Climate Change | 81 % | 16 |