<< Tilbage til sammenligning af EU-stemmer
Sammenligning af stemmeafgivelser i Europa-parlamentet
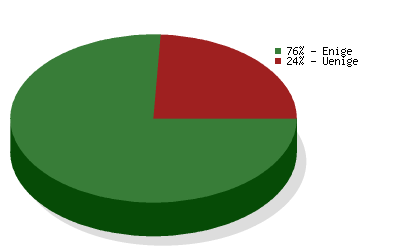
 Socialdemokraterne
vs.
Det Radikale Venstre
Socialdemokraterne
vs.
Det Radikale Venstre 
Sammenligning af stemmeafgivelser i Europa-parlamentet
Sammenligningen er baseret på
4116 afstemninger
og dækker valgperiode 2004-2009
og dækker valgperiode 2004-2009
| Politikområde | Grad af enighed | Antal afstemninger |
|---|---|---|
| Environment, Public Health and Food Safety | 79 % | 363 |
| Budgets | 81 % | 286 |
| Foreign Affairs | 74 % | 259 |
| Civil Liberties, Justice and Home Affairs | 84 % | 242 |
| Economic and Monetary Affairs | 59 % | 229 |
| Industry, Research and Energy | 80 % | 214 |
| Transport and Tourism | 71 % | 211 |
| Budgetary Control | 88 % | 211 |
| Employment and Social Affairs | 77 % | 179 |
| Agriculture | 64 % | 142 |
| EP Delegation to Conciliation | 72 % | 138 |
| Legal Affairs | 86 % | 134 |
| Constitutional Affairs | 84 % | 124 |
| Regional Development | 70 % | 114 |
| Culture and Education | 73 % | 101 |
| Internal Market and Consumer Protection | 85 % | 98 |
| International Trade | 73 % | 94 |
| Fisheries | 66 % | 85 |
| Women's Rights and Gender Equality | 76 % | 74 |
| Development | 85 % | 61 |
| The enlarged Union for 2007-2013 | 91 % | 32 |
| Petitions | 67 % | 21 |
| Use of European countries by the CIA | 100 % | 17 |
| Climate Change | 87 % | 15 |