<< Tilbage til sammenligning af EU-stemmer
Sammenligning af stemmeafgivelser i Europa-parlamentet
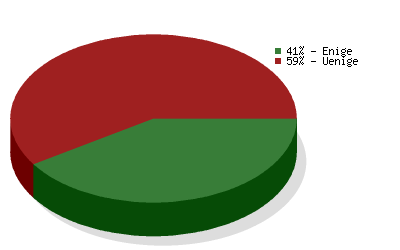
 Det Konservative Folkeparti
vs.
Folkebevægelsen mod EU
Det Konservative Folkeparti
vs.
Folkebevægelsen mod EU 
Sammenligning af stemmeafgivelser i Europa-parlamentet
Sammenligningen er baseret på
3034 afstemninger
og dækker valgperiode 2004-2009
og dækker valgperiode 2004-2009
| Politikområde | Grad af enighed | Antal afstemninger |
|---|---|---|
| Environment, Public Health and Food Safety | 46 % | 252 |
| Civil Liberties, Justice and Home Affairs | 36 % | 200 |
| Foreign Affairs | 43 % | 198 |
| Budgetary Control | 75 % | 194 |
| Economic and Monetary Affairs | 25 % | 183 |
| Internal Market and Consumer Protection | 42 % | 174 |
| Transport and Tourism | 34 % | 157 |
| Agriculture | 40 % | 149 |
| Industry, Research and Energy | 37 % | 149 |
| Employment and Social Affairs | 30 % | 134 |
| Legal Affairs | 67 % | 111 |
| Budgets | 50 % | 108 |
| Culture and Education | 34 % | 104 |
| Constitutional Affairs | 19 % | 95 |
| International Trade | 24 % | 89 |
| Fisheries | 42 % | 69 |
| Regional Development | 21 % | 66 |
| EP Delegation to Conciliation | 23 % | 57 |
| Women's Rights and Gender Equality | 49 % | 53 |
| Development | 76 % | 21 |
| Climate Change | 44 % | 16 |
| Petitions | 56 % | 9 |