<< Tilbage til sammenligning af EU-stemmer
Sammenligning af stemmeafgivelser i Europa-parlamentet
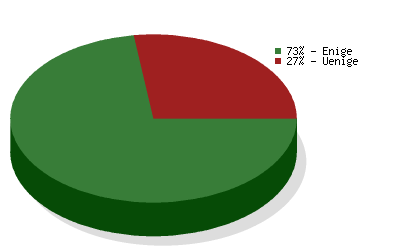
 Det Radikale Venstre
vs.
Det Konservative Folkeparti
Det Radikale Venstre
vs.
Det Konservative Folkeparti 
Sammenligning af stemmeafgivelser i Europa-parlamentet
Sammenligningen er baseret på
3889 afstemninger
og dækker valgperiode 2004-2009
og dækker valgperiode 2004-2009
| Politikområde | Grad af enighed | Antal afstemninger |
|---|---|---|
| Environment, Public Health and Food Safety | 80 % | 343 |
| Foreign Affairs | 75 % | 245 |
| Civil Liberties, Justice and Home Affairs | 68 % | 228 |
| Industry, Research and Energy | 67 % | 224 |
| Budgetary Control | 88 % | 218 |
| Economic and Monetary Affairs | 76 % | 215 |
| Budgets | 80 % | 209 |
| Transport and Tourism | 70 % | 206 |
| Employment and Social Affairs | 65 % | 168 |
| Agriculture | 52 % | 157 |
| Legal Affairs | 77 % | 133 |
| Regional Development | 64 % | 123 |
| EP Delegation to Conciliation | 80 % | 118 |
| Constitutional Affairs | 82 % | 103 |
| Internal Market and Consumer Protection | 83 % | 99 |
| Culture and Education | 77 % | 95 |
| Fisheries | 65 % | 93 |
| International Trade | 78 % | 90 |
| Women's Rights and Gender Equality | 53 % | 76 |
| Development | 93 % | 41 |
| The enlarged Union for 2007-2013 | 71 % | 34 |
| Petitions | 58 % | 19 |
| Use of European countries by the CIA | 78 % | 18 |
| Climate Change | 50 % | 16 |